Emit a synthetic alert metric
You followed the synthetic alert libraries reference, added a few lines to your service, and deployed it. This guide checks that it worked, in about twenty minutes.
You run the library on a short, predictable schedule, so a firing arrives within minutes instead of hours. You check the metric at each stage it passes through, in the service, in your metrics store, and on a graph in Grafana. Then you switch to the defaults you will run in production. Any metrics store that Grafana queries with PromQL will do, such as Prometheus, VictoriaMetrics, or the Mimir that Grafana Cloud runs. The examples use Go, and you will need a service whose metrics that store already scrapes.
Put the library on a short schedule
Wire the library in the way the Go README shows, with one change. Pass four options that make the schedule short and regular:
alert, err := syntheticalert.New(
	// A short, regular schedule for checking the setup.
	// The last step of this guide removes these four options.
	syntheticalert.WithFiringDuration(2*time.Minute),
	syntheticalert.WithMinInterval(3*time.Minute),
	syntheticalert.WithMeanInterval(3*time.Minute),
	syntheticalert.WithMaxInterval(3*time.Minute),
)
if err != nil {
	log.Fatal(err) // only an invalid option can fail
}
promauto.NewGaugeFunc(prometheus.GaugeOpts{
	Name: "triplepat_synthetic_alert",
	Help: "Set to 1 when the synthetic alert should fire and 0 otherwise. " +
		"Alert on this metric and route the alert to a Triple Pat check-in " +
		"timer to continuously test your alerting pipeline.",
}, alert.Value)
Here is the schedule you just built. Every schedule begins with a gap,
counted from the moment New runs, which in most services is at startup.
With every gap set to the same 3 minutes, nothing is random anymore: the
gauge reads 0 for 3 minutes, 1 for 2 minutes, and repeats every 5
minutes for as long as the service runs.
In another language, every library takes the same four settings, under its own names and units. Its README lists them, and the library table links each one.
This guide assumes your metrics store scrapes the service’s metrics
endpoint at least once a minute, so each 2 minute firing spans at least two
scrapes. If you export through OpenTelemetry instead, the
reference
gives the metric’s name on that path, and you can skip the curl check
below.
Deploy the service.
Check that the service exposes the metric
From a machine that can reach the service, ask it for its metrics, using your service’s address in place of this one:
curl -s http://localhost:8080/metrics | grep triplepat_synthetic_alert
You should see:
# HELP triplepat_synthetic_alert Set to 1 when the synthetic alert should fire and 0 otherwise. Alert on this metric and route the alert to a Triple Pat check-in timer to continuously test your alerting pipeline.
# TYPE triplepat_synthetic_alert gauge
triplepat_synthetic_alert 0
The library is wired in and answering. A 0 is what you should see during
the first 3 minutes, and if you happen to catch a 1, a firing is under way.
Both are correct.
Check that your metrics store has it
Next, make sure the metric made it into storage. In Grafana, open Explore, choose the data source for your metrics store, and run:
triplepat_synthetic_alert
You will get one series for each process that emits the metric, with the
labels your scrape adds, usually job and instance. Seeing it at all
means scraping and storage are working.
A check-in timer needs exactly one series behind it, so if you see several,
now is the moment to choose one. For example, our check-in service runs on
five servers and shows five series, and our alert picks one of them with
triplepat_synthetic_alert{instance="main_checkin-service"}.
That instance value is a name our scrape configuration assigns. If yours
is an address such as 10.2.3.4:8080, it may change on your next deploy,
so select on a label that names the process instead, or relabel one in.
One series per check-in
timer
explains which labels survive deploys. Use your selector in every query from
here on. If you have only one series, as in the graph below, the bare metric
name is your selector.
Watch a firing arrive
Before you look, make a prediction. Counting from when New ran, the series
reads 0 for 3 minutes, 1 for the next 2, and repeats that 5 minute
cycle. So the first firing appears 3 minutes after the service starts, and
another follows every 5 minutes.
The third firing ends 15 minutes after the service starts. Wait about a minute past that, then graph your selector over the last 15 minutes. You should see three flat-topped firings, evenly spaced, like this:
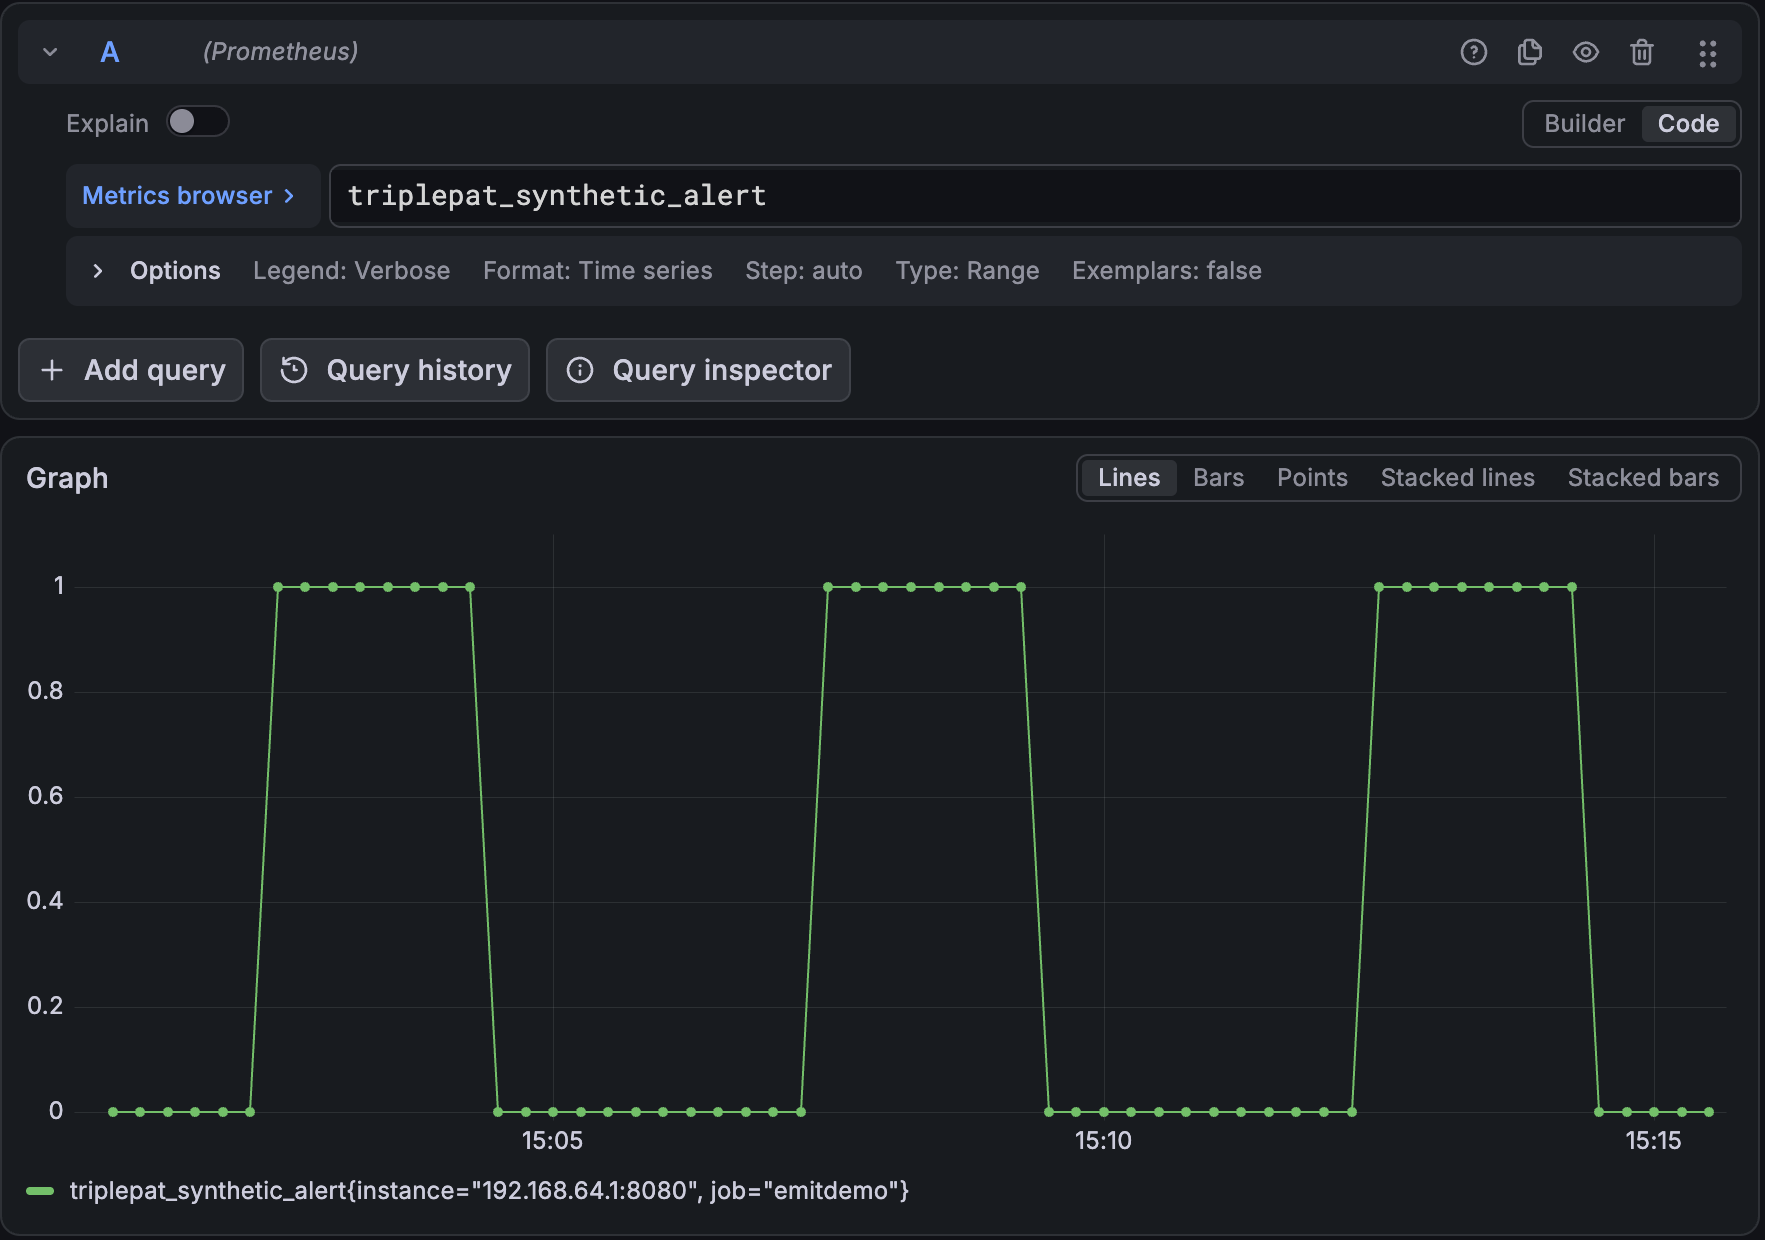
Each firing is a flat run at 1 about 2 minutes long, with 3 minutes at 0
between them. The edges slope only because Grafana draws a line from one
scrape to the next. If the graph starts and ends at 1, you caught a firing
in progress. Wait until the series is back at 0, then graph again.
If your graph matches your prediction, the metric works end to end, from your code through scraping and storage to Grafana, the same path a real alert’s metric takes.
If no 1 ever appears, check these three common causes:
- The scrape is reaching a different process than the one you changed.
- The service is restarting more often than every 3 minutes. Each new schedule begins with a gap, so frequent restarts can keep it from ever firing.
- The scrape interval is longer than 2 minutes, so scrapes can miss whole firings.
Switch to the defaults
The short schedule is predictable, and a synthetic alert should fire at
random, so use it only for this check. Remove the four options, so the call
is syntheticalert.New(), and redeploy. Then run the query from
Check that your metrics store has
it once more. The same series should
be there, reading 0.
The schedule is random again. Each firing lasts 10 minutes, and the gaps between firings run from 10 minutes to 2 hours, averaging about 50 minutes. The first firing after a deploy can take up to 2 hours, so you do not need to wait for it.
When you create the check-in timer that this metric’s alert will feed, size it for these defaults, with a maximum age of 3 hours. A timer sized for the short schedule would leave the phone app raising an alarm every time a normal gap ran long.
Next steps
- Alert on the metric and route the alert to your check-in timer. The Go README’s alert rule and route are the place to start.
- Read why synthetic alerts fire at random, the thinking behind the schedule you just switched to.